vSphere Performance troubleshooting

“The server has poor performance because the server is running virtual.”
“Virtual server are always slower than physical servers.”
“My vSphere server has 60% CPU utilization but the performance of my Virtual Server is poor.”

When you are a VMware administrator you constantly have to defend your self that it doesn’t matter if a server is virtualized or that it running on physical hardware. But how can you troubleshoot these issues?

In these Performance Troubleshooting series I’m going to explain how you can troubleshoot performance problems in your virtualized environment.
This series will contain the following chapters:

  1. CPU
  2. Memory
  3. Storage
  4. Network
  5. Virtual Machine

If you think I left something out. Let me know!

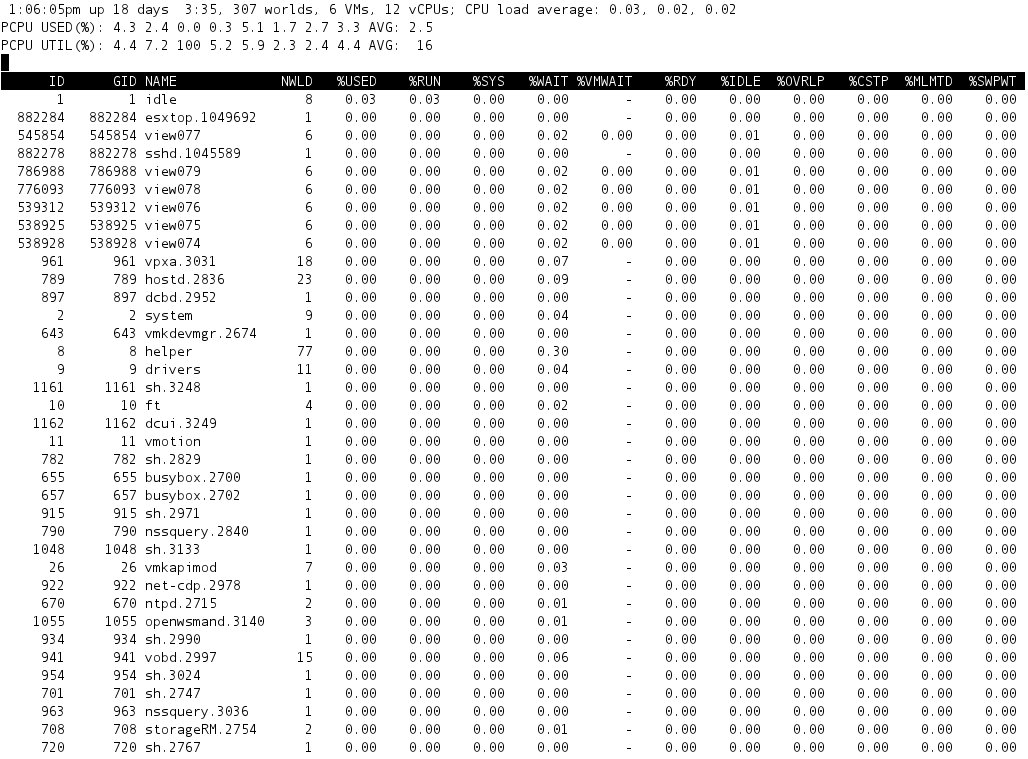
Before you dive into the different chapters, first let me explain how esxtop works.

Running esxtop
You can run esxtop in 2 different ways. One directly in the ESXi Console (the so called busybox) or remote through the remote CLI command called resxtop.
In case you want to run esxtop on the ESXi console,  login as root and start esxtop by typing the command esxtop followed by a enter.

esxtop

If you want to use resxtop start resxtop on a OS where the remote CLI commands are installed with the following parameters:

esxtop –server [dns or ip adres of ESXi host] –user [username probably root] –password [password of the user]

The option –user and –password are not required. If you don’t provide them as a parameter, you will be prompted for them.

Alter esxtop view
When esxtop is started (it doesn’t matter if this is remote or local) you can alter you view.

Option Result
V (Capital) The esxtop screen will only view Virtual Machines. If V is pressed again all other worlds are displayed again.
f Alters the field list. This enables you to create a custom view.
s Changes the refresh time of the screen. This is default 5 sec.
h Help screen
c CPU view
m Memory view
n Network view
i Interrupt view
d Disk Adapter view
u Disk Devices view
v Disk VM view
p Power State view
# Limits the number of rows displayed in esxtop
w Write the alter config. If you just press enter after pressing w, the default configuration is altered. If you provide a path and file-name you can use this configuration the next time you start esxtop. You will have to provide the option -c with the path of the configuration file.
Example: esxtop -c ~/myesxtopconf.cfg

Running esxtop in batch mode
It’s also possible to start esxtop in batch mode. The results are saved in a CSV file. This can be done with the option -b. With the option -d you can specify the delay for the refresh and the option -n specifies the amount of iterations. Example:

esxtop -c ~/myesxtopconf.cfg -b -d 5 -n 10 > ~/esxtop-output.csv

In this example esxtop is started with a custom configruation file called myesxtopconf.cfg, in batch mode, with a delay of 5, and 10 iterations.
With resxtop you have to provide the IP or DNS name of the ESXi host.

The CSV file can be imported in Microsoft Perfmon for example. Note that if you have a large CSV file the import can take a very long time.

vSphere Performance troubleshooting Part1: CPU

Even do vSphere is telling you that the overall CPU utilization is no more than 60%, this doesn’t indicated that your VM isn’t running low on CPU resources.
In this part where going to deepdive in troubleshooting CPU performance related issues on your vSphere environment. Although I’m using vSphere 5.0 for my screenshot, most of the options used also go for vSphere 3 and 4.

Key tool for CPU performance troubleshooting is esxtop or if your running your esxtop remote resxtop.
I my examples I’m using esxtop directly on the vSphere ESXi console but all of these command also work with resxtop.You just have to provide a extra parameter called –server on witch server you want to run the command. Of course you have to provide a username and password to get access to that server.

If we start esxtop on our vSphere ESXi host we will get the following screen:

esxtopcpu01

Click on image to enlarge


First let me explain what we see here.

esxtopcpu02

Click on image to enlarge


The first three lines:

 1:06:05pm  The current time of your ESXi server. Notice that the time is in UTC.
 up 18 days 3:35  How long your ESXi server has been up.
 307 worlds  a world is a process thats running in your VMkernel
 5 VMs  The amount of VMs running on your ESXi host
 12 vCPUs  The amount of vCPU provided to VMs
 CPU load average The average CPU load per 5, 10 and 15 minutues. If the average load is higher than the amount of CPU cores, your system has not enough CPU recourses.
 PCPU USED(%) Real-time amount of CPU usage per CPU core in percentages. As you can see my system is a 8 core system (2 quad core CPUs). AVG: is the average of all pCPU cores.
(4,3 + 2,4 + 0,0 + 0,3 +5,1 + 1,7 + 2,7 + 3,3) / 8 = 25
 PCPU UTIL(%)  Real-time amount of CPU utilizaton per CPU core in percentage. AVG is the average of all pCPU cores. (4,4 + 7,2 + 100 + 5,2 + 5,9 + 2,3 + 2,4 + 4,4) / 8 = 16


After the first three lines you will see a table with like the following:


esxtopcpu03_0

Click on image to enlarge


So let me explain what we see there:

ID  The recourse world id. A world is an ESXi VMkernel schedulable entity, similar to a process or thread in other operating systems.
GID  The resource group world id. A group contains more worlds. If you press e in esxtop and enter the number of the GID, this GID will expand itself in multiple world’s for the same group. Every VM consists of minimum 4 worlds:

  1. vmx: This world is used for vCPU world explained in vmx-vcpu-#.
  2. vmast.#: Ths world is used for memory scanning.
  3. vmx-mks: This world is used for mouse, keyboard and monitor.
  4. vmx-vcpu-#: This world is used for every vCPU of the VM. The amount of vCPU worlds is the same as the amount of vCPU configured for this VM.
NAME  The name of the world or world recourse pool.
NWLD  The amount of world’s in the world recourse pool.
%USED The percentage of physical CPU core cycles used by the recourse pool/world.
%USED = #vCPU*100%
indicates that the VM occupies all the CPU cycles he can takes. Indicates that the VM is running at 100%.
%RUN The percentage of time scheduled. This value can be twice as large as %USED.
%RUN > %USED the pCPU is not running at its rated clock frequency. Probably due Power saving.
%SYS The percentage of time spend in the ESXi VMkernel on behave of the recourse pool/world to process interrupts and to perform other system activities.
If higher than 25 the VM is a high IO VM. If you are aware of this,OK. If not check other statistics.
%WAIT
The total percentage of time the Resource pool/world spent in wait state.
%VMWAIT
=%WAIT-%IDLE
%RDY The percentage of time the Resource pool/world was ready to run.
>20% indicated that the amount of pCPU cores is to low.
%IDLE  The percentage of time the Resource pool/world was idle.
%OVRLP  The Percentage of system time that was spent on behalf of some other Resource Pool/World while Resource Pool/World was scheduled.
%CSTP The  percentage of time the Resource pool/world spent in ready, co-deschedule state.
 >5% This accours when a VM as more vCPUs and one vCPU has to wait on another vCPU in order to catch up.
%MLMTD  Percentage  of time the ESX VMKernel deliberately did not run the Resource Pool/World because that would violate the Resource Pool/World’s limit setting.
%SWPWT


This picture (who I have borrowed from a VMworld presentation) explains the overall relationship between the different variables.

esxtopcpu04

Oke, now we now where the different variables stand for and what there relationship is. The next question will be,  which variables do I have to monitor and what are there thresholds?

Variable Threshold Resolution
%RDY >10% If higher than 10% for a long time, add more CPU cores tho your vSphere host
%CSTP >5% This only occurs in a VM with more than 1 vCPU. Add more pCPU to the host or decrease the amount of vCPUs in the VM
%MLMTD >0% If higher than 0% the vCPU is throttled because of CPU limits
%SYS >20% If higher than 20% the VM is like a high I/O VM. Check guest OS for problems
%RUN >%USED The pCPU is not running at its rated clock frequency. Probably due Power saving.


So that’s what you need to know about monitoring you vSphere ESXi host with esxtop.